Layoff Announcements Skyrocket While Official Data Goes Dark: Flashing Red Recession Signal .… or just an aberration?
- Nov 30, 2025
- 7 min read
Updated: Dec 2, 2025
Challenger recently reports a jaw-dropping 1.09 million job-cut announcements in 2025 so far --- the worst since the downturn of 2020. And large job losses accompany virtually every recession. So is the dreaded "R" word lurking around the corner? Or could there be another explanation (like AI or DOGE)? And if a recession is coming...then what would it mean to alternative investors?

(Usual disclaimer: I'm just an investor expressing my personal opinion and am not an attorney, accountant nor your financial advisor. Consult your own financial professionals before making any financial decisions. Code of Ethics: To remove conflicts of interest that are rife on other sites, I/we do not accept ANY money from outside sponsors or platforms for ANYTHING. This includes but is not limited to: no money for postings, nor reviews, nor advertising, nor affiliate leads etc. Nor do I/we negotiate special terms for ourselves in the club above what we negotiate for the benefit of members. Info may contains errors so use at your own risk. See Code of Ethics for more info.)
Over the last few weeks, there’s been a growing divergence in the labor-market data.
On one side: the Challenger layoff announcement report is flashing a bright-red warning siren. On the other: the official government data (through September) still looks like a cooling-but-not-collapsing job market.
And as if that weren’t murky enough, the 2025 shutdown means some of the most important October data simply doesn’t exist. That missing dataset might end up being a small footnote… or the biggest blind spot of the year.
Below is a walk-through of what we actually know, what we’re missing, and what (in my view) deserves watching.
Houston, We Have a Layoff Problem
The recently released October Challenger, Gray & Christmas Gray & Christmas report was a shocking jolt:
153,074 announced layoffs in October (highest October in 20 years). This was up 175% year-over-year.
And year to date, there have been a jaw-dropping 1.09 million cuts -- the worst since 2020.
Challenger reported:
“This is ... the highest total for a single month in the fourth quarter since 2008. Like in 2003, a disruptive technology is changing the landscape. Over the last decade, companies have shied away from announcing layoffs in the fourth quarter, so it’s surprising to see so many in October. With the onset of social media, and the ability for workers to share their negative experiences with their employers, the trend of announcing layoffs before the holidays fell away, a practice that seemed particularly cruel."
More more, see “U.S. Layoff Announcements Surge to Two Decade High” from Reuters.
To get more perspective on this, I took the Challenger data and aggregated it by year. And then I plotted in a chart. And then I overlaid the last recessions (in gray). Note: I could have made a mistake so use at your own risk.

High Challenger readings do generally appear to be associated with recessions.
And 2025 isn't even done yet (so presumably will get higher). But it's already higher than most non-recessionary period in the last several decades.
The only non-recessionary period higher was in the mid 2000's (which Challenger says was a time of disruptive transition). And large job cuts are okay, if there are also large job gains (which Challenger doesn't track).
Déjà Vu All Over Again?
Challenger’s historical analysis helps frame the scale of what we’re seeing so far in 2025:
Year-to-date cuts now exceed 1.1 million — something last seen only during the COVID collapse in 2020.
Only a small # of years in the last 36 have exceeded this threshold.
Million-plus cuts typically appear in recessionary or structural dislocation years: like 2001, 2008–2009, 2020, and the mid-2000s automation wave.
So this isn’t the kind of print that generally pops up in a "normal" environment.
And Goldman Sachs also highlighted the Challenger data in their recent report: “There are Growing Signs of Weakness in the US Job Market”. And they added another indicator is blinking "red":
In addition, Goldman Sachs Research’s real-time tracking of Worker Adjustment and Retraining Notification (WARN), which companies have to file before conducting mass layoffs, has also ticked up, reaching its highest level since 2016 (outside of the initial pandemic surge).
Here's is Goldman's chart with both Challenger and WARN...and I've manually marked the leadups to the last two recessions in yellow (and red below for the recession itself):

Additionally, Goldman says:
Our economists have, in addition, introduced a tool tracking layoff discussions among publicly listed companies by analyzing earnings call transcripts from firms in the Russell 3000 index. It shows that the share of companies mentioning layoffs has increased recently.
Meanwhile at BLS Headquarters…
The last full government dataset we have is the September Employment Situation report. And it looked relatively calm.
Payrolls were still growing (although slowly). The unemployment rate remained low by historical standards. And wage growth was cooling rather than collapsing.
However, the October household survey was never conducted because of the government shutdown — and can’t be reconstructed after the fact. That means we’ll never get unemployment, labor-force participation, or household-level employment data for that month.
Historically, the household survey often picks up turning points sooner than the payroll survey.
So losing that data point creates a meaningful blind spot at exactly the time when other indicators are starting to flash yellow.
Follow the Breadcrumbs
Goldman Sachs Research pointed out that :
“measures of Challenger … typically lead initial claims by about two months.”
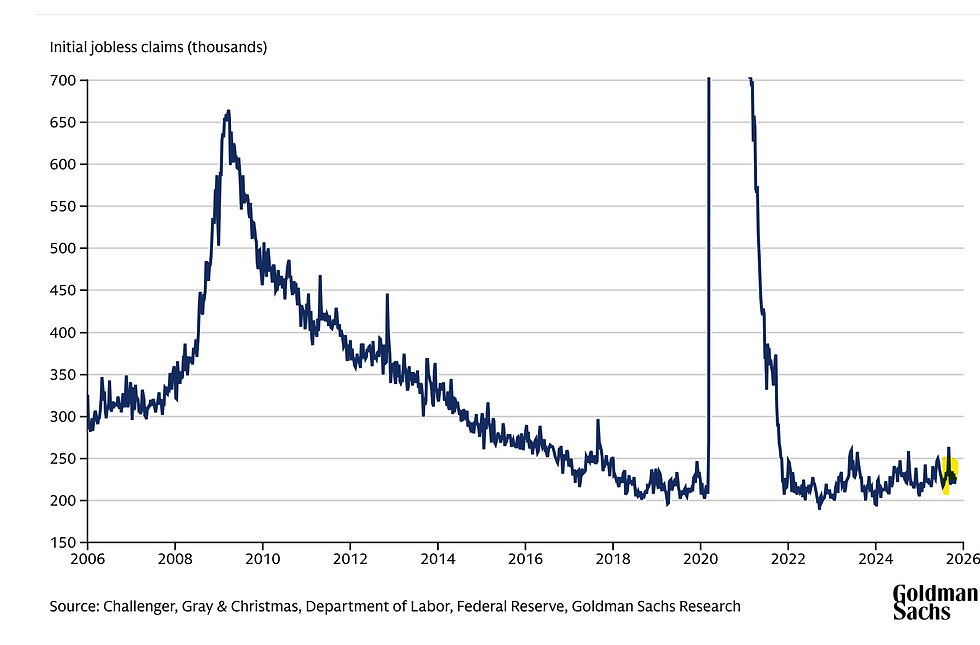
Why does this matter? Initial jobloss-claims are very important, because they're correlated with virtually every recession (and are considered to be one of the most solid economic indicators of trouble): Here's a look over the last several decades (and yellow where we are today). Note that the job loss in the 2020 covid recession dwarfed all the previous recessions (and skews the chart).

Here's a (from Goldman). And so far, all is quiet with initial jobless claims:
Et tu AI?
Goldman says it isn't quite sure what the influence of AI is on the the large layoff announcements:
It isn’t yet clear to what extent these layoffs may be a result of companies replacing workers with automation using artificial intelligence (AI), according to Goldman Sachs Research. “So far, we do not find clear evidence that most of the increase in these measures is directly motivated by AI, even if we see large increases in tech layoffs across both the Challenger and WARN measures,” Abecasis and Mei write. “As our portfolio strategy team noted, only a small number of S&P 500 firms have explicitly referenced AI when discussing large-scale layoffs. Most companies instead point to the need to streamline and restructure operations, sometimes attributing these changes to new technologies that enable efficiency gains.”
What About Government layoffs?
Thanks to an astute reader who pointed out it could be a one-time aberration due to government layoffs (associated with the shutdown). That's seems like another valid interpretation. Digging deep into the data:

Yes, DOGE was a big factor. But arguably not all. YTD job loss still looks elevated without it (~600k+ jobs cut)
Speaking of government job cuts: we could be potentially in store for another shut-down in a few months (as the can was merely kicked a few months down the road to January 30th , 2025). If so, it's not clear if that would also involve job cuts or not. Also, it seems job shedding in government jobs may still be ongoing (regardless of shutdown).
Additional government cuts might not matter. Or they could be a kick in the shin (in an anemic growth environment). We'll have to wait and see what happens.
What next?
The only way to know for sure it to watch initial jobless claims over the next 2 months.
And the key will probably be whether the spike materializes into actual layoffs (initial jobless claims)....or not.
What Would a Recession Mean for Alternative Investors?
Private Investor Club members invest across a broad spectrum of alternatives — some tightly tied to business cycles, some loosely tied, and some largely uncorrelated. The implications of a weaker labor market are different for each bucket.
Business-cycle sensitive strategies:
Certain credit funds
Certain venture and late-stage growth
Certain traditional private equity
Certain consumer/lender platforms
These tend to feel labor-market stress first. Layoffs can translate into slower revenue growth, higher borrower stress, more covenant pressure, and/or lower exit valuations.
Mixed-correlation strategies:
Certain commercial real-estate credit funds
Certain infrastructure funds with demand exposure
Certain middle-market buyout strategies
Certain real-estate funds
These tend to sit in the middle. They may or may not react sharply depending on asset class, region, leverage, tenant or customer mix, and/or access to financing.
For example the Commercial Real Estate (CRE) Price Index has historically gone up in recessions (green), gone down (red) or done both (blue):

And this is because part of CRE (the "space" market ...meaning rent and vacancy) is tied to the U.S. business cycle. But the other part (the "pricing" market) is tied to things outside of the U.S. economy (like global capital inflows).
For more info on CRE price cycles, see my interview with the author of the most cited CRE text-book in the world: Dr. David Geltner :"What will the next downturn look like? Part 1: Interview with Dr. David Geltner"
Low/No-correlation strategies:
Certain GP stakes funds
Certain music royalty funds
Certain litigation finance funds
Certain life settlements funds
These are more insulated and tend to move based on things unconnected with the business cycle. That includes fee stability, contractual cash flows, demographic fundamentals, or court timelines…rather than jobs.
Bottom Line: A Big Spike, A Missing Dataset, and an Open Question
The Challenger spike is historically large and typically associated with economic stress points — whether cyclical recessions or structural shifts.
So far, the official data (through September) doesn’t show the same degree of stress — but missing October household data means we may have lost an early-warning indicator.
If a recession does occur the impact will vary widely across strategies. Credit and other cycle-sensitive assets are most exposed, while structurally uncorrelated strategies may barely notice.
The next few months of jobless claims will help clarify whether this is a genuine turning point or just a misfiring warning light amplified by a temporary data blackout.
Digging deeper / Learning More
Join the discussion on this topic (with thousands of other investors) in the Private Investor Club.
If you're already a member, click here to discuss further.
If you're not yet a member, then joining is free.
To protect all members and keep the conversations useful and confidential, all applicants are required to verify that they're solely investors (and not investment sponsors, platforms or their affiliates)
Click here to learn more or to join.


